Information Design [ Exercises ]
02.04.2025 - .2025 week 1 - week 3
Sheryne Axellia Putri / 0367267 / Bachelor of Design (Honours) in Creative Media
Information Design
Exercises
TABLE OF CONTENTS
1. Lectures
2. Instructions
3. Feedback
4. Reflection
LECTURES
Week 1 02.04.2025_Type of Infographics
Infographics → A way of communicating ideas in a visual form.
Different types of infographics are used in design and marketing to present information in a simple and visually appealing way. They can be a useful alternative to standard text-based content.
Types of Infographics
⤷ 1. List Infographics

Figure 1.1 Week 1 (02/04/2025) Final Outcome.
A list infographic is an informational graphic that uses a written list to get a message across. It’s full of written copy, but it’s also highly visual. 2. Statistical Infographics
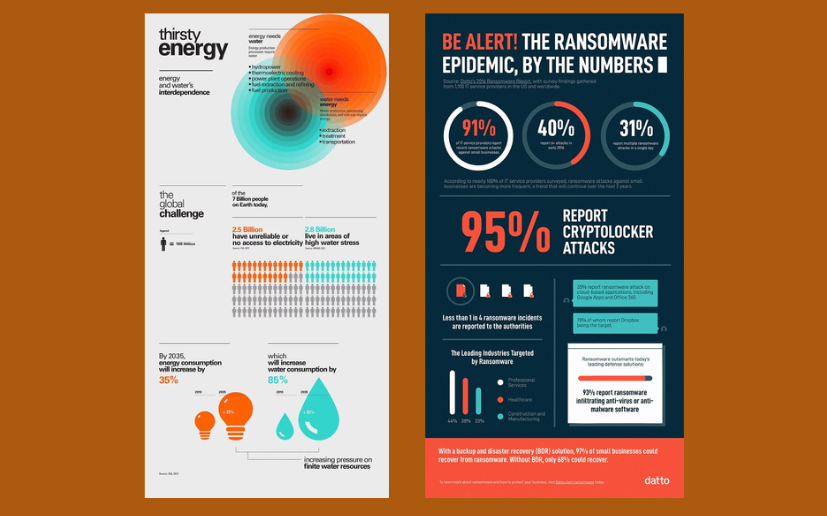
Figure 1.2 Week 1 (02/04/2025) Final Outcome.
A statistical infographic is an infographic that includes pie charts, bar graphs, and any other visual representations of data. Using a statistical infographic to represent the information in a visual way is more easier to understand.
3. How-to Infographics

Figure 1.3 Week 1 (02/04/2025) Final Outcome.
Explains how to do something, like how to solve a problem or perform a task. Compared to a paragraph or written list, the how-to infographic makes each step of the process easier to absorb.
4. Timeline Infographics

Figure 1.4 Week 1 (02/04/2025) Final Outcome.
Timeline infographics are one of the most diverse in terms of their use. When creating this type of infographic, be sure to use icons and illustrations along the full length of the timeline to represent each point.
5. Comparison Infographics

Figure 1.5 Week 1 (02/04/2025) Final Outcome.
A comparison infographic is a visual way to compare and contrast different options. By presenting two or more alternatives side-by-side, this type of infographic helps readers understand the distinction between various concepts and, in many cases, choose which option is best for them.
6. Map/location Infographics

Figure 1.6 Week 1 (02/04/2025) Final Outcome.
Map infographics can be used for a variety of purposes. People tend to use them when they want to communicate demographic data or other location-specific information.
7. Flowchart Infographics

Figure 1.7 Week 1 (02/04/2025) Final Outcome.
A flowchart infographic is a graphical representation of an information stream, such as a sequence of different steps or actions. This type of infographic boosts engagement while giving users a very clear idea of what the process is about.
Because it guides people individually through the various steps, it feels more personal and tends to resonate closely with potential audiences.
8. Process Description Infographics

Figure 1.8 Week 1 (02/04/2025) Final Outcome.
A process description infographic visually describes the main elements, actions, and steps of a process. A process description infographic to communicate technical information or a complex series of actions. It’s useful because it highlights the most important steps, and simplifies complex ideas by breaking them down and then grouping them by category.
Week 2 02.10.2025_L.A.T.C.H Theory
Richard Saul Wurman — the person who coined the term “information architect”, in his legendary book “Information Anxiety” wrote :
“Information may be infinite, however… the organization of information is finite as it can only be organized by LATCH: Location, Alphabet, Time, Category, or Hierarchy. I’ve tried a thousand times to find other ways to organize, but I always end up using one of these five.”
L → Location, this is the technique of organizing information based on its location. This gives a spatial order to the information.
A → Alphabet, organizing the content Alphabetically is probably the easiest way to group information, mainly because alphabets are universally recognized. However, we should ensure that the actual labels are also something which maps with model of the user.
T → Time, this scheme uses the temporal nature of content for organizing information. This is very effective in Social media websites, where users would like to know about the most recent events in their contacts’ lives.
C → Category, this is by far the most frequently used technique of organizing content on websites. Category refers to any meaningful group, with reference to the website or the audience.It is very important , however, to define categories which make sense to your users.
H → Hierarchy, refers to arranging information by any order, such as, size, cost (Low to High OR High to Low), popularity etc.
INSTRUCTIONS
Figure 2.1 Week 1 (02/04/2025) Module Information Booklet.
Exercise 1 _ Quantifiable Information
Gather a set of objects and separate it into categories such as color, shape, pattern, and another quantifiable factor, example:
1. Box of Lego
2. Jar of button
3. Jar of marble ball
4. Set of colorful rubber strap
In this exercise, you're required to quantify our chosen objects and arrange them into a presentable layout or chart. The information must be presented as is, and you need to arrange the objects with relevant indicators written out with pens to help you to visualize the quantity and data. Examples of objects that can be used are buttons, coins, lego pieces, M&Ms, and more.
1. Photo of the random objects before sorting out
2. Objects sorted out by categories (2 - 5 categories)
3. Write and design the information on a piece of paper.

Figure 2.2 Week 1 (02/04/2025) Data planning.
1. Progress
For this exercise, I bought colorful ice cream sticks. However, when I applied them to the A3 paper, the sticks were too large and prevented me from creating the shapes I wanted. As a result, I decided to switch to using coins (of which I have quite a lot).

Figure 2.3 Week 1 (02/04/2025) Data of the coins.

Figure 2.4 Week 1 (02/04/2025) Coins sorted.

Figure 2.5 Week 1 (02/04/2025) Coins arranged.
Each coin tells a story of change, the back of the coin (tails) of the two versions are different from the other, with this, I can tell a story of my coins with their colors, size, tails, and year of release.
#1 Layout
.jpg)
Figure 2.6 Week 2 (02/10/2025) #1 layout.
Since I want to use the theme that history is connected to us, i created a layout and made the coin as a line that is connected with each other. With 5-sen being the center, and the combination of different versions of the coins to create a line.
#2 Layout

Figure 2. 7Week 2 (02/10/2025) #2 layout.
I wanted to make the shape of a kite but it was harder than I thought, then I thought again, maybe I should see this more in the bigger picture.

Figure 2.8 Week 2 (02/10/2025) #3 layout.
At first, I wanted to envision the coins as buildings or pillars.... but no, I arranged them again and now it looks like a statistic infographic.

Figure 2.9 Week 2 (02/10/2025) #4 layout.

Figure 2.10 Week 2 (02/10/2025) Final Outcome.
Exercise 2 _L.AT.C.H Theory
1. Organize a group of information into a visual poster that combines and utilizes the LATCH principles (Minimum 4).
2. You are required to use the digital photo editing/illustration software available to assemble the information into a LATCH infographic poster.
3. You are allowed to reuse back the images but you have to create the rest of visuals to complete the poster.
REQUIREMENTS:
1. Size resolution: A4 size
2. Progress and submission link on E-Portfolio.
1. Progress
After thinking about the topic for this exercise, I was thinking about creating an infographic about something that I like; flowers, & shells. But, I really want to try making an infographic about animals, especially mammals, so I go with bears. By talking about bear species.
1.1 Research
I collect my data about each species, including their population, habitat, range, and size. The L.A.T.C.H consist of :


- L: Habitat of each bear species.
- A: List bears alphabetically (Black Bear, Brown Bear, Panda Bear, Polar Bear, Sloth Bear, Spectacled Bear, Sun Bear).
- T: frequency of documented bear attacks per species over decades.
- C: Categorize bears based on their aggression levels and likelihood to attack humans. Highly Dangerous (Polar Bear, Grizzly Bear). Moderately Dangerous (Black Bear, Sloth Bear). Least Dangerous (Sun Bear, Spectacled Bear, Panda Bear).
- H: Bears in alphabetical order.
1.2 Digitalization


I drew each species of the bear while maintaining accuracy.

The color palette I chose for this exercise.

I traced the map and made it simpler, while the format is A4, I tried to fit the continents of Asia, America, and Europe together. I was sort of having difficulties with the layout.
2. Final Outcome
.png)
FEEDBACK
Week 1
- General feedback, create a story of how you categorize your items, for example by color, shapes, size, and texts.
- Specific feedback, I showed my sketch and idea to revolve my infographic coins to history to Mr. Fauzi, and he said that there must be a balance between both graphic and the info. Both have to support each other.
REFLECTION
Experience
The exercises for this module are engaging and enjoyable. I particularly liked creating my Exercise 2 poster, as it allowed me to illustrate my own elements and design an infographic based on my personal interests. This combination of creativity and information-making made the task highly rewarding.
Observation
An effective infographic poster should be thoughtfully designed with a focus on guiding the viewer's eye direction. Consider how the layout influences visual flow and engagement to maximize the impact of the information presented.
Findings
Initially, I believed that an infographic poster was simply another type of poster. However, I have since learned that there are significant differences between the two. Infographic posters are specifically designed to visually represent information, data, or concepts in a more engaging and easily digestible format, whereas traditional posters may focus more on artwork or text without the same emphasis on data visualization.


Comments
Post a Comment